1
“The dashboard should tell us what to do.”
A standard report is a starting point. It cannot know the decision your team owns, the retailer context, the shopper need, or the tradeoff you are trying to resolve.
C8 • Retail Data Mini-Course
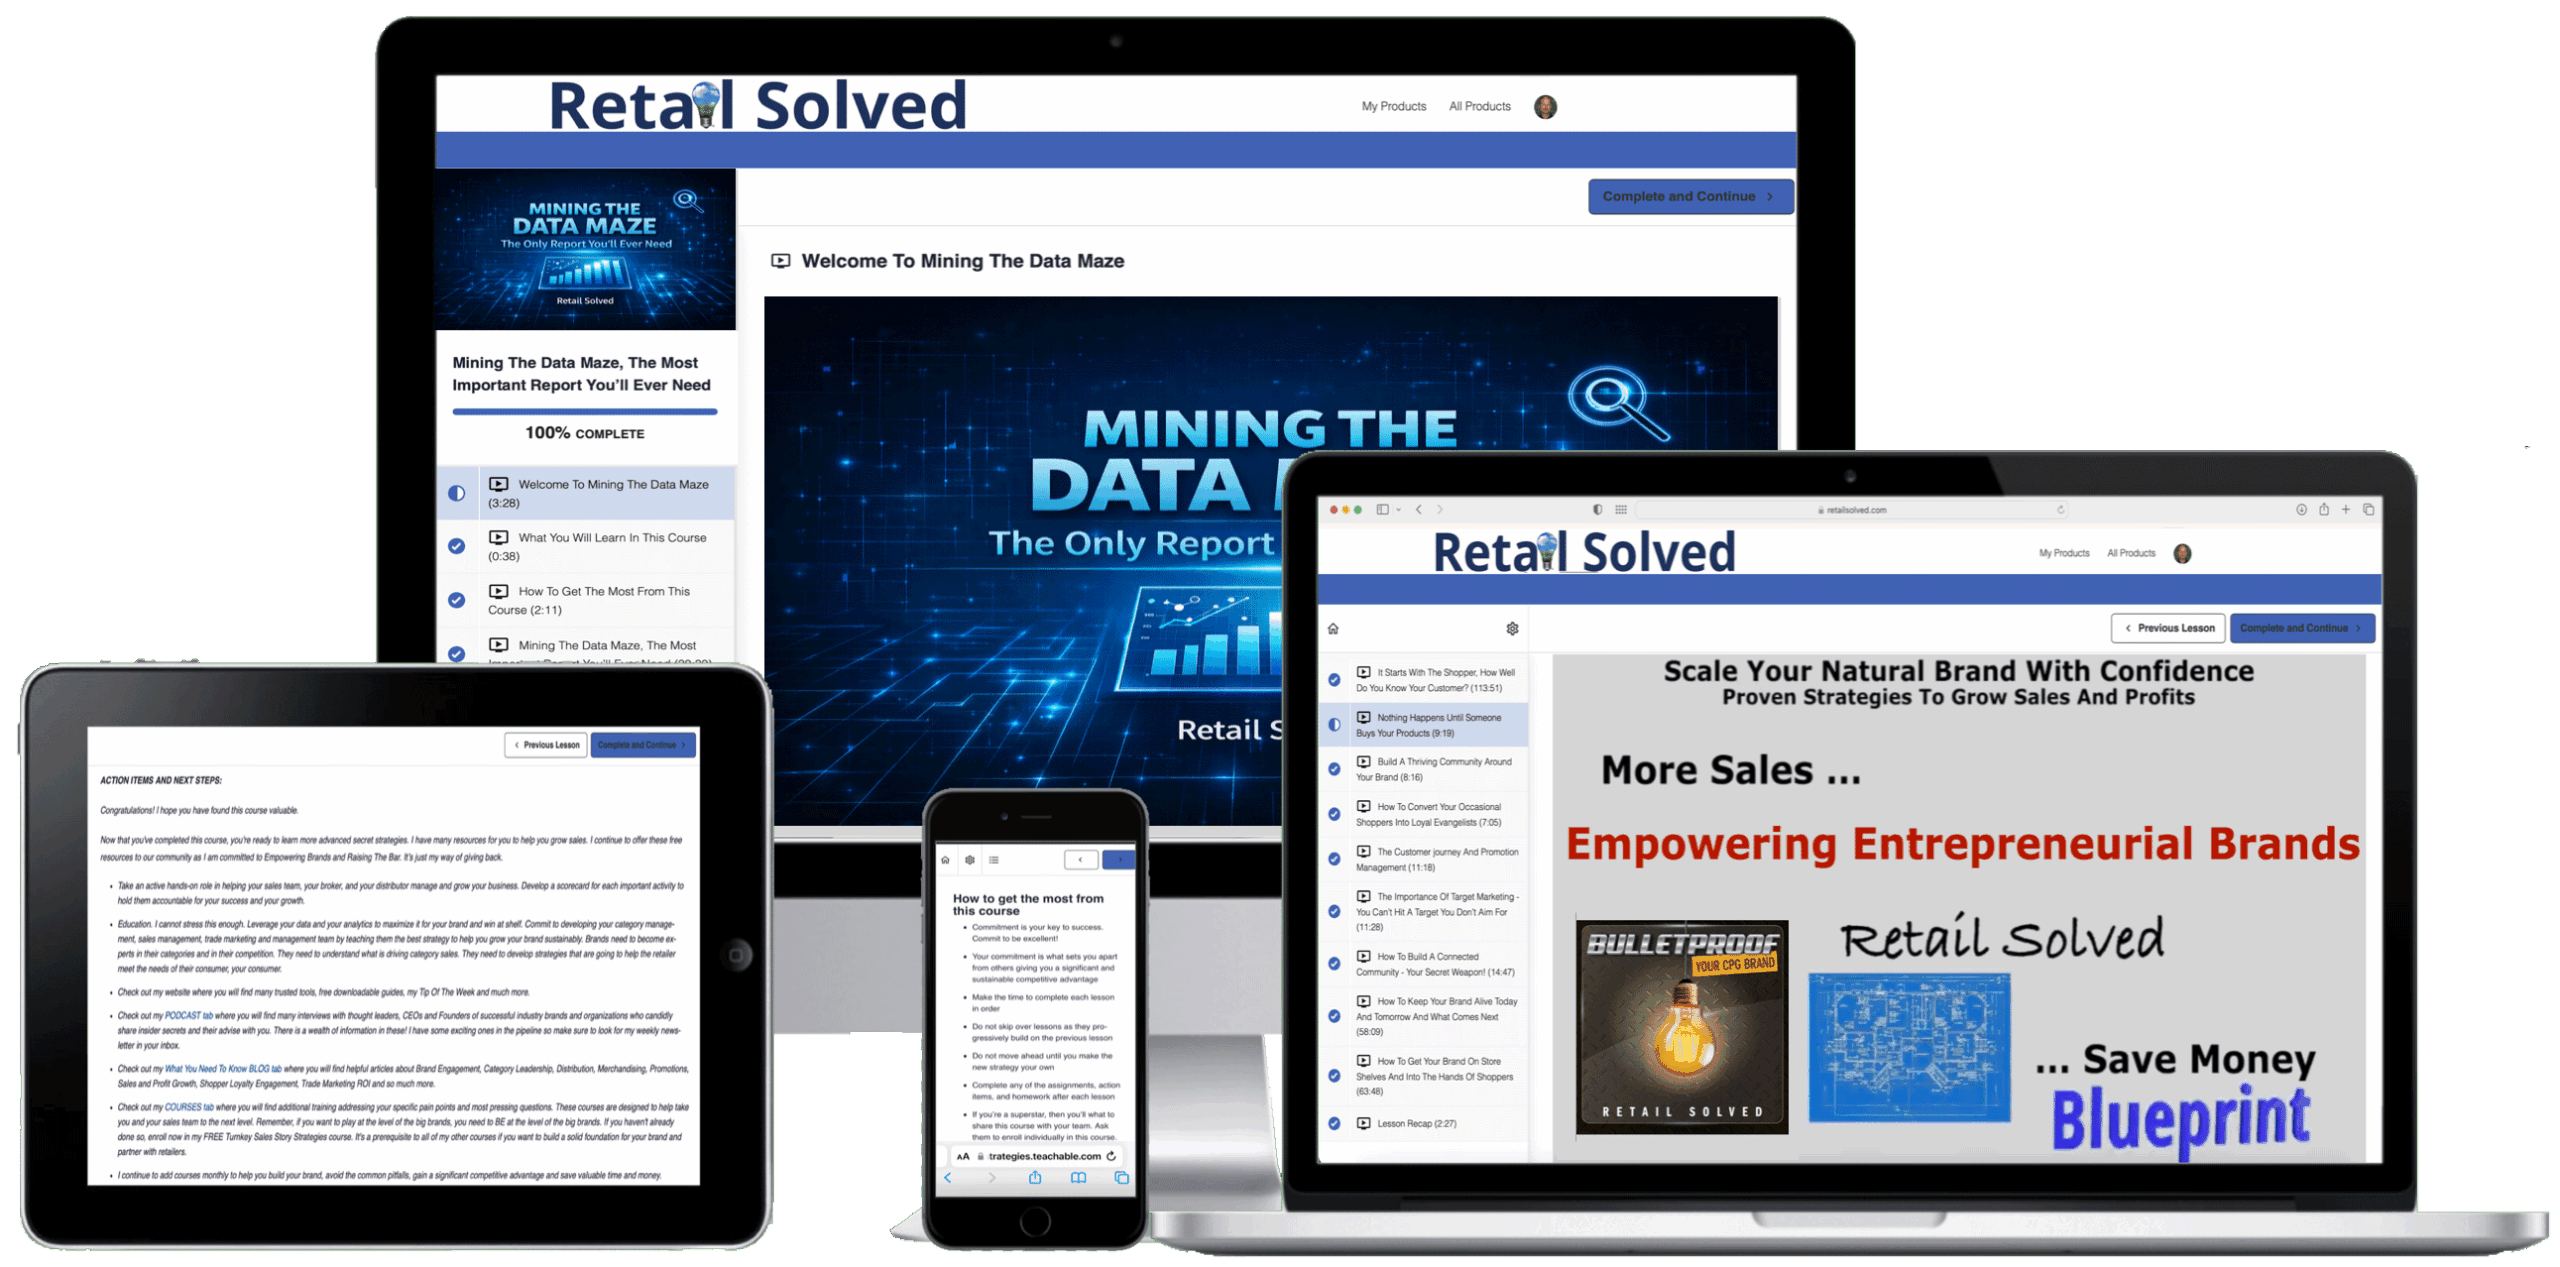
Learn how to turn a crowded category report into a decision-ready retail snapshot that shows what is changing, where the opportunity may be hiding, and what deserves attention next.
Includes the course example spreadsheet • 14-day guarantee

The real problem
POS reports, distributor files, syndicated dashboards, broker spreadsheets, retailer scorecards, promotion reports, and internal trackers can all be accurate—and still leave the team debating what to do.
Watch the course preview
The course shows how to move beyond a generic topline report by adding the measures, segmentation, filters, and shopper context that help reveal a stronger retail story.
The three beliefs that keep brands inside the maze
A standard report is a starting point. It cannot know the decision your team owns, the retailer context, the shopper need, or the tradeoff you are trying to resolve.
Extra measures often create extra debate. Begin with the question, then choose only the data needed to understand it.
Provider and retailer taxonomies may not reflect how shoppers compare products. The wrong competitive set can produce a clean report and a weak conclusion.
What you will learn
A practical operating rhythm
The course is not about becoming a data scientist. It is about building a repeatable way to use the information you already have.
What decision must this analysis support?
Which retailer, category, segment, item, shopper, and time period matter?
What changed—and what other context could have influenced it?
What is the next useful action, owner, or question?
What each layer contributes
Do not ask one data source to answer every question. Use each source for the part of the decision it can support.
The quick win
Choose one live question. Use one retailer and one relevant category or segment. Then simplify the report until every column earns its place.
What changes
How I learned it and earned it
Early in my career, I developed category-management reports for major CPG companies and retailers. I later built the original SPINS distribution tracker and other reporting tools.
That experience taught me both sides of the problem: templates create consistency, but the canned report is only the starting point. The real value comes from asking a better question, rebuilding the category around the shopper, and turning the analysis into a decision.


Your instructor
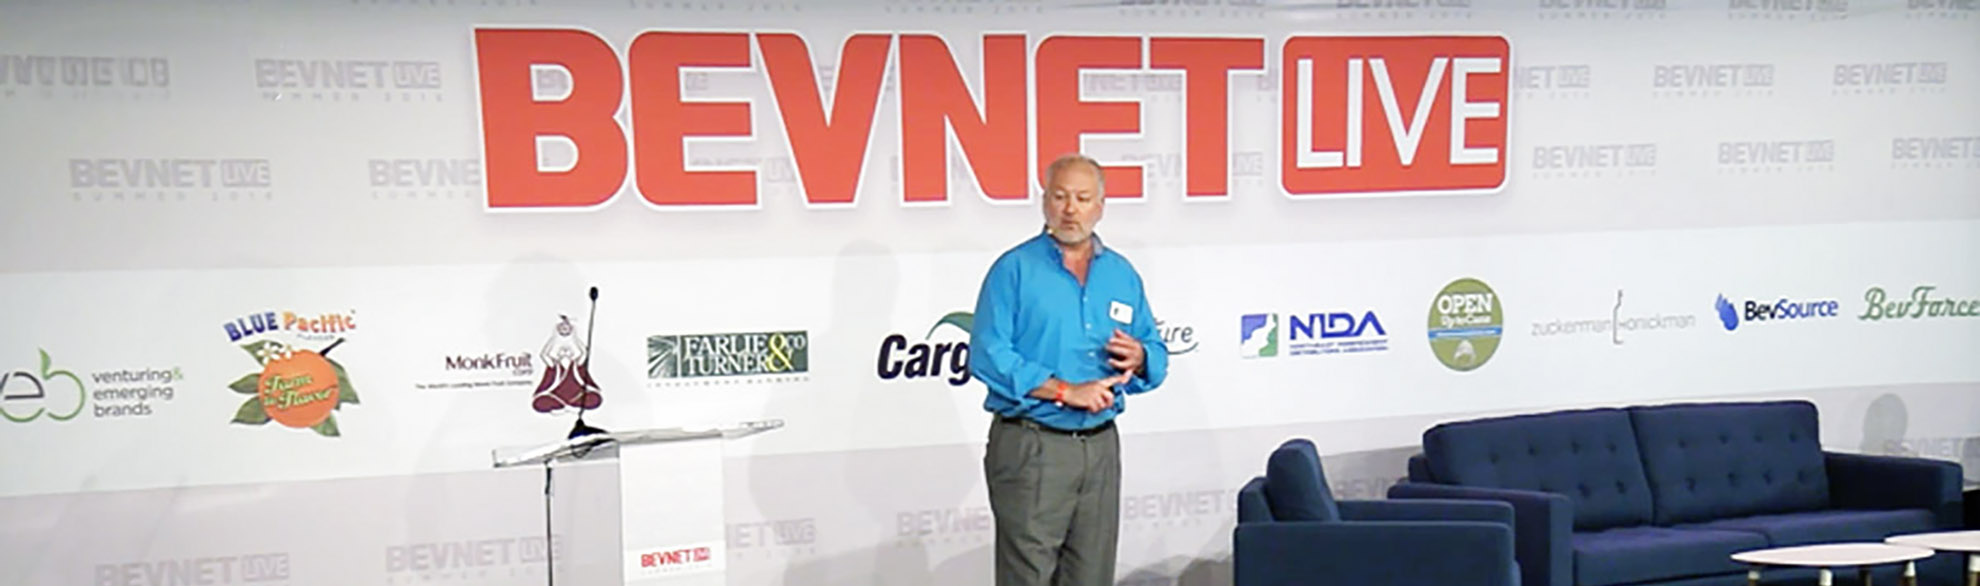
I have spent decades helping brands, retailers, category teams, brokers, and founders use retail data to see opportunities that a standard ranking report misses.
This course shows you the practical foundation: how to choose the right view, add the right context, use the example spreadsheet, and turn a crowded report into a clearer decision.
Frequently asked questions
No. The principles can be applied to retailer POS, distributor reports, shipment files, syndicated data, broker reports, and other consistent retail data. The quality of the answer depends on the coverage, accuracy, and limitations of the source you use.
The course teaches from an example spreadsheet designed to demonstrate the measures, formulas, segmentation, and filters discussed in the lessons. Confirm that the current download is available inside the course before publishing this page.
No. “The only report you’ll ever need” describes a flexible decision-ready foundation, not a universal answer. Different decisions may require different retailer, shopper, promotion, execution, financial, or competitive inputs.
You should be comfortable opening a spreadsheet, reviewing columns, adding basic formulas, and using filters. The course is intended to make the thinking easier, not turn you into a programmer.
Begin with one live decision: a retailer review, distribution opportunity, category question, assortment issue, promotional result, or competitive concern. Then select the smallest useful view that can support that decision.
You have 14 days to review the course. If it does not give you practical ideas you can use to simplify one real retail analysis, email Retail Solved and your purchase will be refunded.
The spreadsheet is not the product
Use one real question, one category view, and one retailer to build a report that helps your team understand what matters—and what should happen next.
Instant access • Regular price $297 • 14-day guarantee