1
“Sales growth means the brand is healthy.”
Sales can rise because of deeper discounts, more stores, forward buys, retailer activity, or expensive support. The question is what produced the growth and whether it can continue.
C7 • Brand Health Mini-Course
Learn how to evaluate one SKU at one retailer using the sales, distribution, trend, and shopper signals that reveal whether growth is getting stronger—or simply getting more expensive.
Focused. Practical. 14-day guarantee.

The expensive misunderstanding
A brand can increase sales while becoming more dependent on promotions, broader distribution, retailer support, or founder intervention. That activity can look healthy while cash, margin, execution, and decision quality quietly weaken.
Watch the course preview
Learn why total sales, brand rank, cash in the bank, and investor interest can create confidence without proving that the underlying business is getting stronger.
The three beliefs that keep brands guessing
Sales can rise because of deeper discounts, more stores, forward buys, retailer activity, or expensive support. The question is what produced the growth and whether it can continue.
A small brand can rank below a heavily promoted national brand while contributing more for every point of distribution it has earned.
Another promotion, retailer, broker push, or SKU can amplify the original problem when the team has not identified the real constraint.
What you will learn
The quick win
Use one SKU at one retailer. The goal is not to diagnose every part of the company. The goal is to determine whether the item is becoming more productive where it is already sold.
A clearer way to read performance
Total sales show scale. Distribution shows reach. Sales per point of distribution helps you understand what the brand contributes where it is actually available.
What changes
How I learned it and earned it
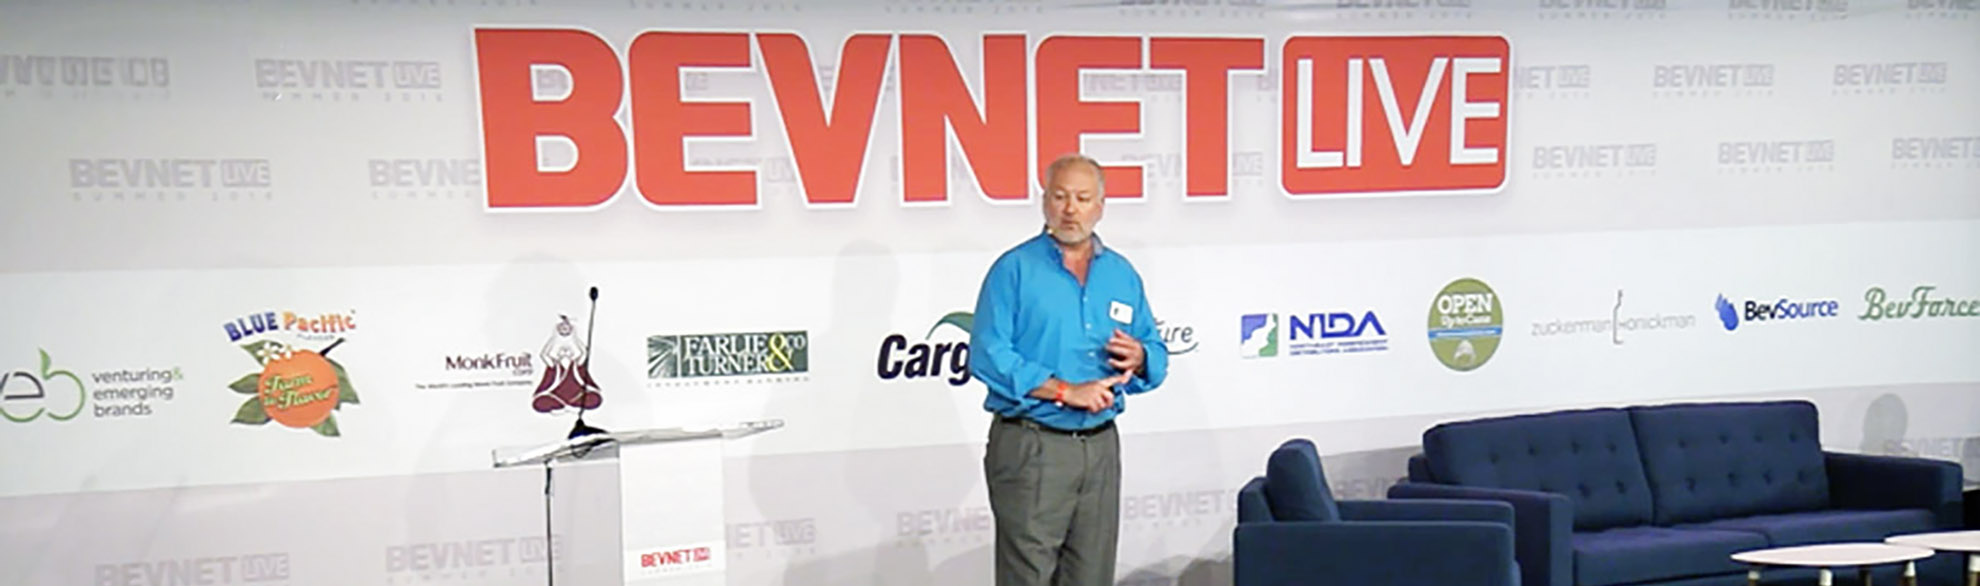
I have worked in retail stores, direct-store delivery, key accounts, category management, category leadership, syndicated data, natural CPG, and founder leadership.
I built custom analyses when standard ranking reports did not explain the real opportunity. The lesson was consistent: the spreadsheet is not the product. The decision is.


Your instructor
I have seen brands look healthy because sales were rising while margin, execution, distribution quality, and decision clarity were moving in the wrong direction.
This course does not promise to diagnose the entire company. It gives you a practical way to evaluate one item at one retailer, challenge the obvious conclusion, and decide what deserves attention next.
Frequently asked questions
No. The current course is focused primarily on sales productivity where you have distribution, including sales per point of distribution, trends, retailer contribution, and the limitations of ranking reports. It is a focused starting point, not a full operational audit.
For the cleanest calculation, you need sales and a measure of distribution for the same period. ACV distribution is helpful. Retailer-level store count or another consistent distribution measure can also help, provided you clearly label the limitation.
Yes. Use the measure that fits the question. Dollar productivity can be useful for premium products and retailer contribution. Unit productivity can help when price points differ or when you are evaluating physical movement.
No. Syndicated data can make the comparison stronger, but you can begin with retailer POS, distributor reports, store-level sales, shipment data, and the most consistent distribution measure available.
That is a signal to investigate. The decline may be connected to broader distribution, weaker stores, promotion dependence, execution gaps, availability, retailer mix, or another factor. The course helps you see that the next move should not be automatic.
You have 14 days to review the course. If it does not give you practical ideas you can use to evaluate one real SKU or retailer, email Retail Solved and your purchase will be refunded.
Clarity before activity
Start with one SKU. Evaluate one retailer. Build one clearer view of contribution, trend, and the next question that deserves your attention.
Instant access • Regular price $297 • 14-day guarantee