
Your retail buyer says your CPG product isn’t selling. The report puts your SKU near the bottom of the assortment, and your shelf space is at risk. Before you accept the cut, ask these five questions.
A retailer sales report can be accurate and still miss the explanation that changes the decision. Were the products really comparable? Were shoppers able to find your item? Did sales fall because of demand—or because the retailer stopped carrying it in some stores?
In Episode 346 of Bulletproof Your CPG Brand, Daniel Lohman, CPSA, shows CPG founders and retail teams how to challenge costly assumptions without picking a fight with the buyer.
YOU’LL LEARN:
• Why a 10-count item and a 10-ounce item aren’t equivalent just because the file says “10.”
• Why POS, shipments, on-hand inventory and on-shelf availability answer different questions.
• How to separate declining distribution from declining productivity per store.
• What a four-week window misses after a price change, promotion or shelf reset.
• What even a sophisticated dashboard or AI analysis cannot see about the shopper.
TRY THIS BEFORE YOUR NEXT RETAILER MEETING: Pick one important SKU and one retailer. Ask what the report compares, what it observes, what store base it represents, what changed during the period, and which missing fact could change the recommendation.
See how Dan organizes category and retailer evidence into reusable tools: https://retailsolved.com/DecisionTools
Continue the decision-clarity lesson: Episode 330 — https://retailsolved.com/session330
Learn the expensive lesson before your brand has to pay for it.
Listen where you get your podcast








Like what you’ve heard?
Please leave a review and comment on iTunes
Let me know your most pressing question, I’ll do my best to answer it on a future episode.
346 Your Retail Report Is Accurate. Is It Answering the Right Question? Your retailer says your product isn't selling fast enough. They've reviewed the report. Your SKU is near the bottom, and they're considering giving that space to something else. Before that happens, I want you to ask five questions. Because that report might be completely accurate—and still be missing the one thing that would change the decision. I've spent much of my career helping brands and retailers work through decisions like these. I built the original SPINS Distribution Tracker for exactly this reason - because brands needed a more useful way to see where distribution opportunities existed. And one lesson keeps coming back: the report isn't the decision. Let me show you why. Imagine you're preparing for a retailer meeting. The retail buyer has a spreadsheet showing price, units, velocity and assortment. Your brand is performing below the average. The recommendation is simple: cut the SKU. Before you learn that your brand is in jeopardy, there is a simple strategy you can use to help protect it. This can also help you avoid being in this situation in the first place. I'm Dan Lohman, and this is Bulletproof Your CPG Brand. Now, Let’s roll up our sleeves and get started. You have a choice. Manage your own distribution or let someone else management it for you. That puts your brand at risk and puts your brand at the mercy of the retailer or a competitor. Let me explain. When a competitor introduces a new item, the retailer needs to find room for it on the shelf. The first thing they look at are the bottom performing items. If you’ve been listing to this podcast for a while, you hear me always recommending that you identify items that could potentially be discontinued to make room for your new item. That is the focus of todays conversation. The industry standard is to use the 80/20 rule where the bottom 20% of items are ripe for being discontinued. This outdated strategy ignores the why behind your brand and the why behind your brand is what shoppers are searching for. On episodes 342 and 344 you hear me share real life stories about why this matters and how you can use your brands why to future proof your brand. Don’t wait until your brand is at risk of loosing distribution. This needs to begin when you first introduce your brand at retail and it needs to be repeated in every retailer meeting. The why behind your brands unique shopper is what differentiates your brand from others and why traditional ranking reports overlook the value you bring to the category. That needs to be considered before any assortment change recommendation. Here are the five questions I ask when a retailer report recommends a consequential move. Question # one: Are we comparing the right products? Look beyond the specific category labels. Are the sizes, units, formats, product attributes and competitive sets actually comparable? A ten-count box and a ten-ounce bag do not become equivalents because both happen to have a ten in the item description. Likewise, a premium specialty format and a mainstream value format may not be serving the same shopper need. This sounds elementary. It isn't. I've seen how much work goes into cleaning the taxonomy behind syndicated data. Manufacturer names, package types and product descriptions don't always come through in the way a retailer decision requires. Before analyzing the result, verify the product description and all the product details are correct. Question # two: What did the report actually observe? A point-of-sale report measures transactions - what scans through the stores registers. A shipment report measures product moving through a supply chain. An inventory record measures what its system believes is on hand. A shelf photo documents what was visible at a moment in time. Those are useful signals. They are not interchangeable. Imagine the inventory report says six units are in a store. The shelf is empty. Both observations might be accurate: the units could be in receiving, misplaced or simply not available to the shopper. Now what about the other stores in the chain. Can your shopper find and buy your brand at all of the stores you are authorized in? If a retailer concludes the product has weak demand based only on sales while the shopper couldn't find it, we may be confusing missing availability with missing interest. Question # three: What's the denominator? This one matters when brands gain or lose distribution. Did units decline because shoppers stopped buying at stores where the product remained available? Or because the number of scanning stores changed? If total sales fell after distribution was reduced, I want to examine sales per comparable selling store, with the same item and time-period definitions. I frequently see situations where a brand looses distribution in some stores. This happens for a verity of reasons and a lot of brands overlook this - a big mistake. With a brand I recently worked with they would routinely gain distribution in every store within a chain when the product was introduced BUT then a few months later their product was only available in a fraction of the stores. It was as though their brand just fell of the store shelves and disappeared. Imagine how loosing perhaps 35% of a retailers stores might negatively impact your velocity. I see this all the time and across multiple brands and retailers. Don't compare a nationwide total from one period with a smaller authorized store base in another and pretend the entire difference is shopper demand. Sales dollars, units, units per store per week, and distribution each answer a different question. A strong decision connects them. Question # four: What happened during the time period? Suppose the report covers four weeks. Did the brand raise its price? Was a competitor on promotion? Did your item go out of stock? Was the product moved to a place shoppers were not looking? Was that the week a retailer reset its shelf? A four-week number can tell you exactly what happened in those four weeks. It can't automatically tell you whether those four weeks reflect the normal business. Before changing the assortment, I want a clean baseline and enough history to interpret the event. Sometimes the answer changes when you compare the right periods. Six months is typically the length of time an items has to prove itself. Question # five: What can this data not see? This is the one I care about most. Your retailer's sales report sees purchases that occurred in that retailer. It doesn't automatically see the shopper who went looking for a product, couldn't find it, and bought elsewhere. The report does not automatically see changes in shopper behavior like seasonality, inflation, or holidays and special events. For example, soup sales are greater during the cold months. It may not see how the brand affects the rest of the shopping basket. It may not see the shopping occasion, why somebody prefers that format, or why a seemingly slow SKU brings a valuable shopper into the store. That missing context doesn't mean you should save every slow seller. Some products absolutely should be removed. Retailers have limited space and need productive assortments. But if you're making a permanent decision about a shelf, you need to know what the evidence can—and cannot—support. Now think about what happens if you hand that same incomplete data to a more sophisticated dashboard or an AI tool. The output might be faster. It might look more impressive. AI may identify patterns that are genuinely useful. It might look more credible. But a system cannot directly observe a shopper behavior or store condition that isn't in its inputs. If that missing fact is important, you need another signal. Better technology makes judgment more important, not less. So here's how I'd handle that retailer meeting. I wouldn't walk in and tell the buyer their report is wrong. The data may be doing exactly what it was designed to do. I'd say: We reviewed the item and store performance. Can we look at a few factors that might change the interpretation before we make a final assortment decision? Then I'd bring the clean comparison, the consistent store base, the relevant time periods, and any additional evidence that matters—availability, shopper behavior, basket information, or competitive activity where available. The goal is not to win an argument. It's to help the retailer make a better category decision and protect productive sales - items that increase shopper traffic, build the basket, and provide a competitive advantage in the market. I've built tools and worked with category data for decades, and I can tell you this: one of the most expensive mistakes a brand can make is putting a lot of confidence in an answer to the wrong question. So here is your Retail Muscle rep for this week. Pick one report your team trusts. Just one. Choose one retailer and one product that matters. On a sheet of paper, write down five things: One: Are we comparing the right items and units? Two: What does this source directly observe? Three: What is the correct store or distribution denominator? Four: What changed during the time period? Five: What missing fact could reverse the recommendation? If you can't answer one of those questions, that doesn't mean throwing away the report. It means you've identified the next piece of evidence you need before spending more money or giving up retail space. That's how you start building the capability behind better retail decisions. And if you want to see how I organize retailer and category information into practical, reusable analysis, I've posted examples of my Retail Clarity Decision Tools at RetailSolved.com/DecisionTools. Take a look at what's possible, and think about the decision you're trying to make. I also have another episode about the cost of trusting a convincing report without seeing what it couldn't tell us. It's Episode 330. The numbers can be right. The decision still deserves a better question. I'm Dan Lohman. Thanks for listening, and remember: learn the expensive lesson before your brand has to pay for it. You can get this weeks free download as well as the show notes at retailsolved.com/session346
Enter your name and email address below and I'll send you periodic brand building advice, tips and strategies.
Sign up to receive email updates
FREE Trade Promotion ROI Calculator:
Click Here To Maximize Sales And Profits
You are probably losing money to deductions you never questioned.
Learn how to identify the root cause, prevent avoidable losses, and recover money before deductions quietly drain cash.
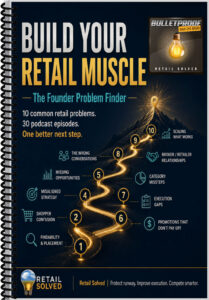
335+ podcast episodes. Start with the problem in front of you.
Choose the retail problem you are facing and get three conversations, one practical action, and the next resource to help you build that muscle.
Retail Operating System™
The complete 11-module framework for protecting margin, optimizing trade spend, and scaling distribution with confidence.
Retailers run on systems.
Most brands run on hustle.
That gap is expensive.
The Retail Operating System™ is the only structured, data-driven retail growth framework built by a Certified Professional Strategic Advisor who has sat both in the founder seat and across the table from retailers.
It gives emerging CPG brands the same operational discipline, trade strategy, and category leverage that big brands use — simplified and systemized to protect margin, optimize trade spend, and extend runway while scaling distribution.
This is not education.
It’s infrastructure.
Image is the property of CMS4CPG LLC, distribution or reproduction is expressively prohibited.
Leave A Comment